Your computer is comprised of many important parts that have to work together to provide you with the best digital experience. Most users are aware that the Central Processing Unit or the CPU is called the brains of the PC. Well, if the CPU is the brain, then the GPU is the soul of your computer. The Graphics Processing Unit is responsible for all the graphics controllers, as well as mathematical and logical operation within ALU (Arithmetical Logical Unit). This is the part that will eventually develop into a modern day artificial intelligence.
So, it’s important for the user to know what the GPU usage is. Sometimes we are not exactly in tune with our machine. We try to enhance the digital experience by getting new software and even hardware, but we are not exactly sure if the system is equipped to handle these changes. That is why it’s important to know what GPU usage is like and if you can even afford to make these changes. And Microsoft has recognized this need by detailing the GPU-monitoring tools in Windows 10’s Task Manager. This feature was added in the Fall Creators Update, so if you don’t have it installed yet, we suggest you get on it. You will, of course, be able to see the GPU intake if you are using a previous operating system like Windows 7 or 8, but the information will be less detailed.
The new features of the Windows Display Driver Model made it possible to get the GPU information and display it directly from the allocated resources, such as the GPU scheduler, the Memory Manager, and the WDDM’s graphics kernel. If you don’t see the whole complexity of the GPU intake, you are probably still using an older type of driver. The system will be compatible with a WDDM 2.x driver, but not a WDDM 1.x driver. Use this step-by-step guide to find out what driver you are using:
Pro Tip: It is possible to fix many PC issues by using the PC Repair tool. PC Repair is easy to use and reliable Windows optimization software developed to fix hundreds of system issues.
Special offer. About Outbyte, uninstall instructions, EULA, Privacy Policy.
- Step 1. Simultaneously press Windows+R and open the dialog box.
- Step 2. Type ‘dxdiag’ into the box and hit Enter.
- Step 3. Open the DirectXDiagnostil tool.
- Step 4. In the Display tab, select Driver Model.
- Step 5. In the description, you should find the name of the driver you are using.
How can I check percent GPU usage on Windows?
The information you are looking for is basically hidden in plain sight. It was never hidden per say, but the developers seemed to think that giving the user access to this information is not relevant. But it turns out that many people would want to get access to it. And so, you will need to do some tweaking before you can open this Pandora’s box. First of all, you need to make it accessible to its full extent and understand the potential. Follow the instructions below to make sense of the GPU Usage Application:
- Step 1. Open the Task manager (Ctrl+Shirt+Esc on your keyboard).
- Step 2. Opt for the “More details” section.
- Step 3. When you have opened the full view of the Task Manager, go to the ‘Processes’ tab and right-click any column header.
- Step 4. You will be able to enable the GPU option, and from then on you will be able to see the GPU resources of each application.


To make sense of what you are actually being shown, read on. At the top of the column, you will see the total GPU usage of all the applications that are being used on your computer. The highest usage of the application is shown in the GPU column correlating to the application. You can also get access to the amount that is used by each application – it’s stated in the GPU Engine column.
If you want to know how much video memory a certain application is using, you can also access this information. In Task Manager, you have to enter the Detail tab and right-click the Select Columns option. You will see different columns that are giving you different percentages:
- GPU
- GPU Engine
- Dedicated GPU Memory
- Shared GPU Memory
Knowing where to look for this information will be helpful to you because you will know how much memory – physical memory – is being used by one program or the other. And this means that you can adjust your needs accordingly, especially if you are thinking of getting some new software or hardware.
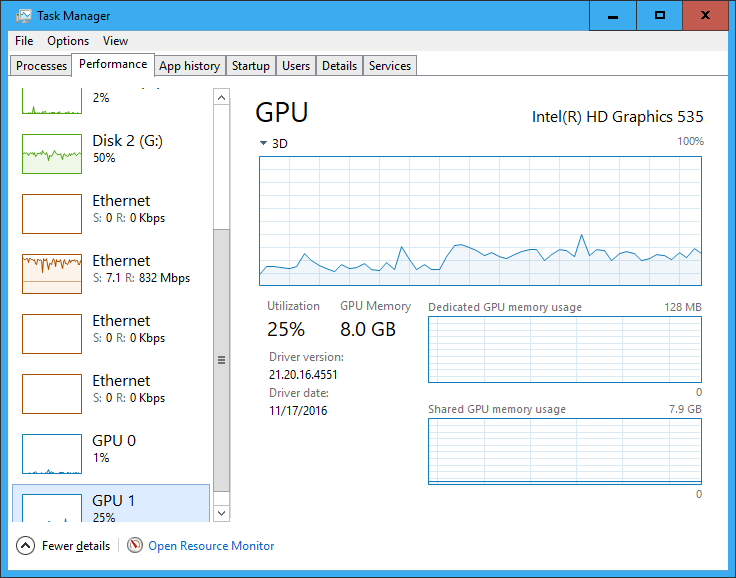
The Overall GPU resource usage is giving you the statistics under the Performance Tab. Scroll down to see the GPU option in the sidebar, and you will see the multiple options to choose from. This is where you can get some insight on how much real-time GPU is being used. You can make the decision of which driver is working at full capacity and if you need to customize some of the applications that you are using so that the GPU is dispersed more evenly. Or if you need to boost the speed on one particular application at the expense of some less relevant one.
The information that we brought forward in this article will help the user to understand the percentage of how much of GPU is actually being used. This could be important information if you are working your machine to the end of a tether. This is also a great tool to enhance the graphics features in video games or 3D experiences.
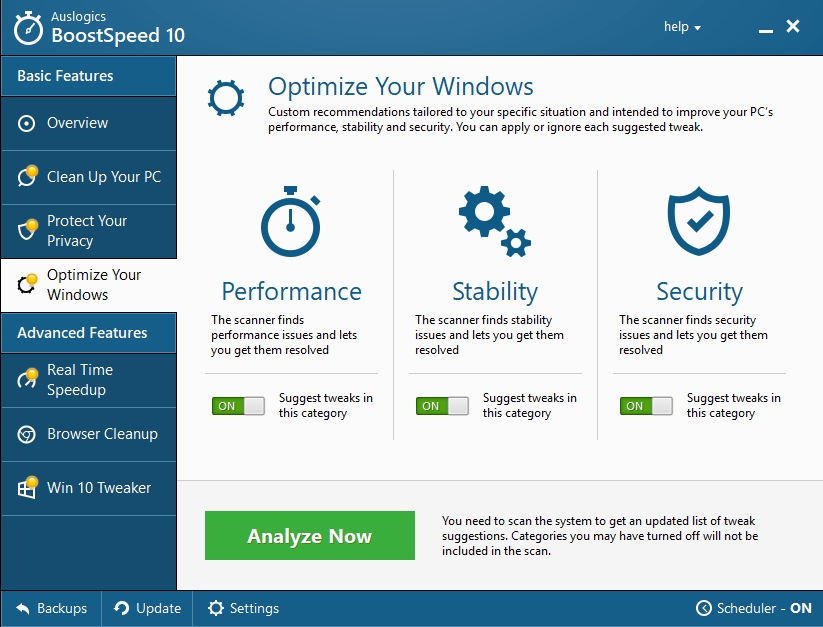
As a valid option, you can always use another tool that will help you stay on track of your computer’s capabilities. We sometimes forget how much pressure we put our devices under. We expect the memory to accommodate any new software that we have encountered. Unfortunately, more times than expected this mindless consumerism ends in the computer not being able to process the information we have provided it with. Download and install Auslogics BoostSpeed so that your system is not overwhelmed and you are always on track with the applications that you need.


The scanning that this tool provides will help you understand which software is using more GPU than needed. Or maybe it will give you some basic insight into some much-needed cleanings, for example, reducing the amount of obsolete software that is only taking up space on your computer.